Your Caregivers Aren't Telling You Why They Leave. Here's How to Find Out.
Free exit interview questions for home health aides, CNAs, and coordinators. A turnover cost calculator with cited benchmarks. And an anonymous text-based exit survey service if you want it done for you.
What Is Caregiver Turnover Actually Costing Your Agency?
Plug in your numbers. Defaults pre-loaded from BLS wage data (May 2024) and 2025 home care industry benchmarking.
Your Annual Turnover Cost
Why do home health aides quit?
Home health aides most commonly leave due to unpredictable schedules, insufficient or unreliable hours, low pay relative to retail and warehouse alternatives, difficult client assignments without support, and lack of communication from the agency. Industry benchmarking puts median caregiver turnover at 75% in 2025, and roughly 40% of new caregivers leave within their first 100 days, making early-tenure retention the most leveraged window.
What is a push departure vs. a pull departure in home care?
A push departure means something inside your agency drove the caregiver out -- scheduling chaos, unresponsive supervisors, unreliable hours. A pull departure means an external opportunity drew them away -- better pay elsewhere, a family situation, geography. As a working assumption, around 55% of home care exits are push departures, meaning more than half are potentially avoidable with operational changes. Your actual ratio can run higher or lower depending on local labor market and operational maturity -- which is exactly what an exit survey is designed to measure.
Push Departures
Something inside your agency drove them out.
- Schedule changes with no notice
- Reported problems ignored
- Hours promised but not delivered
- Difficult clients with no support
- No recognition or growth path
Pull Departures
An external opportunity drew them away.
- Higher pay at another agency or sector
- Family or personal relocation
- Career change (nursing school, etc.)
- Shorter commute elsewhere
- Health or life circumstance
The exit line is never the real reason.
Every departure has two layers. The surface reason is what they say on the way out. The real driver is what an anonymous survey uncovers. The fix only becomes visible once you see the pattern.
What they say
"I found something closer to home."
"The schedule didn't work for me."
"I just need a change."
What the data shows
Manager never responded to shift complaints.
Promised 30 hours/week, averaged 18.
Reported a client safety issue twice. Nothing happened.
The operational fix
Require coordinators to acknowledge every shift request within 24 hours.
Audit actual vs. promised hours monthly. Flag gaps over 20%.
Create a documented escalation path for client concerns with a 48-hour response SLA.
The first column is all you get from hallway goodbyes. The second and third require structured, anonymous data.
What exit interview questions should a home care agency ask?
A home care agency exit interview should cover scheduling predictability, supervisor responsiveness, income reliability, whether the caregiver felt valued, and whether they saw a path forward. The most important single question is a forced push-pull choice: did you leave because of something inside this agency, or because of an external opportunity? That distinction determines whether the exit was avoidable.
Free field guide: download and keep
No email required. Six pages on why caregivers really leave, the five retention dimensions, and what to do about it this month.
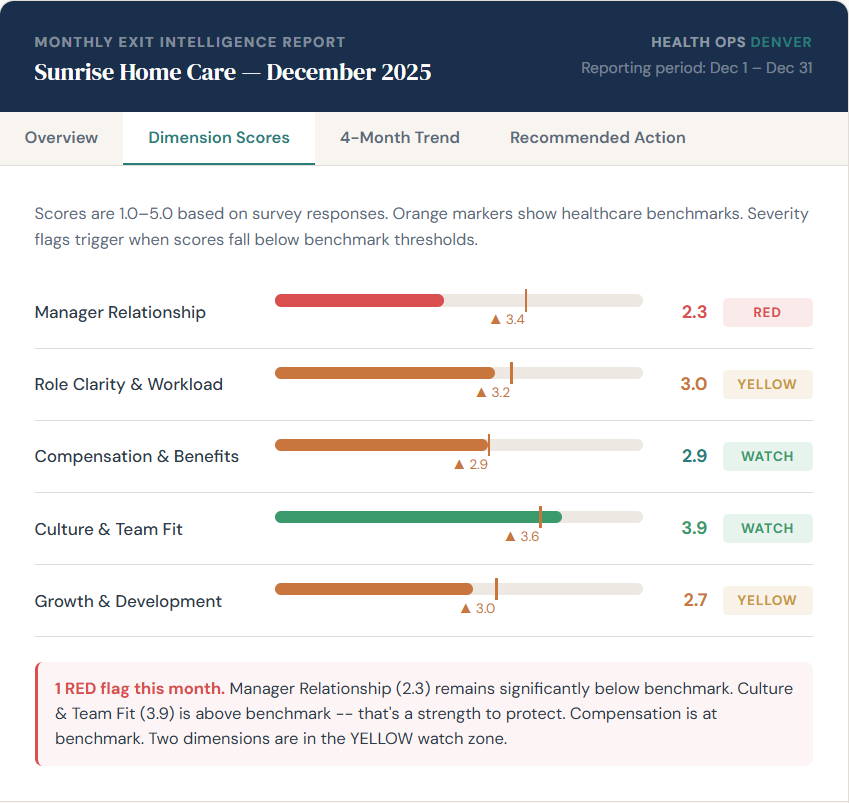
Five dimensions that predict whether someone stays or leaves.
Every exit survey response is scored across these five dimensions. The lowest-scoring dimension is where your next operational change should focus.
Manager Relationship
Does the employee's direct manager acknowledge concerns and act on them?
Role Clarity & Workload
Were expectations clear, and was the workload sustainable?
Compensation & Benefits
Does pay feel competitive for the role and the market?
Culture & Team Fit
Did the employee feel like they belonged here?
Growth & Development
Was there a visible path forward?
Filled bars = illustrative scores from a sample agency. Orange marks = preliminary working targets we are calibrating as our home care dataset grows; expect these to adjust as more agencies report. Your scores replace the samples after your first month of exit data, and you'll see your trend against your own historical baseline alongside the developing industry view.
How much does it cost to replace a home health aide?
The published industry average is approximately $2,600 per departure, accounting for recruitment advertising, background checks, orientation training, lost productivity during the vacancy, and overtime paid to other aides covering shifts. Actual cost varies with hourly wage, weeks-to-fill, and overtime exposure. At 75% annual turnover, a 50-aide agency could spend roughly $97,500 per year on replacement alone, and considerably more when wages run high or vacancies linger.
How do you reduce caregiver turnover in a home care agency?
Start by finding out why caregivers are leaving your specific agency, not the industry in general. Anonymous text surveys sent within 48 hours of departure produce more candid answers than hallway conversations. Track push vs. pull ratios monthly. Identify the dimension scoring lowest against benchmarks and make one focused operational change for 60 days before evaluating.
What should a home care agency do with exit interview data?
Aggregate exit interview responses monthly to identify patterns across departures. Classify each exit as push or pull. Score five retention dimensions against industry benchmarks. When the same issues appear across multiple departures, that's an operational problem, not a people problem. Pick one dimension, make one change, track for 60 days.
Most agencies don't have a people problem. They have a visibility problem.
Exit data turns a vague sense that "turnover is high" into a specific, fixable operational issue. Here's what changes when you can actually see what's driving departures.
From "they left for more money" to a 72-hour schedule lock
If three consecutive monthly reports score Role Clarity & Workload below 3 with comments referencing last-minute schedule changes, the data is telling you the issue isn't pay -- it's predictability. The fix is operational: commit to releasing next-week schedules by Thursday for 60 days, then check whether scheduling-related comments drop in the next round of reports. That's a two-month feedback loop that is simply not possible without structured exit data.
From "it's personal" to a real conversation with one supervisor
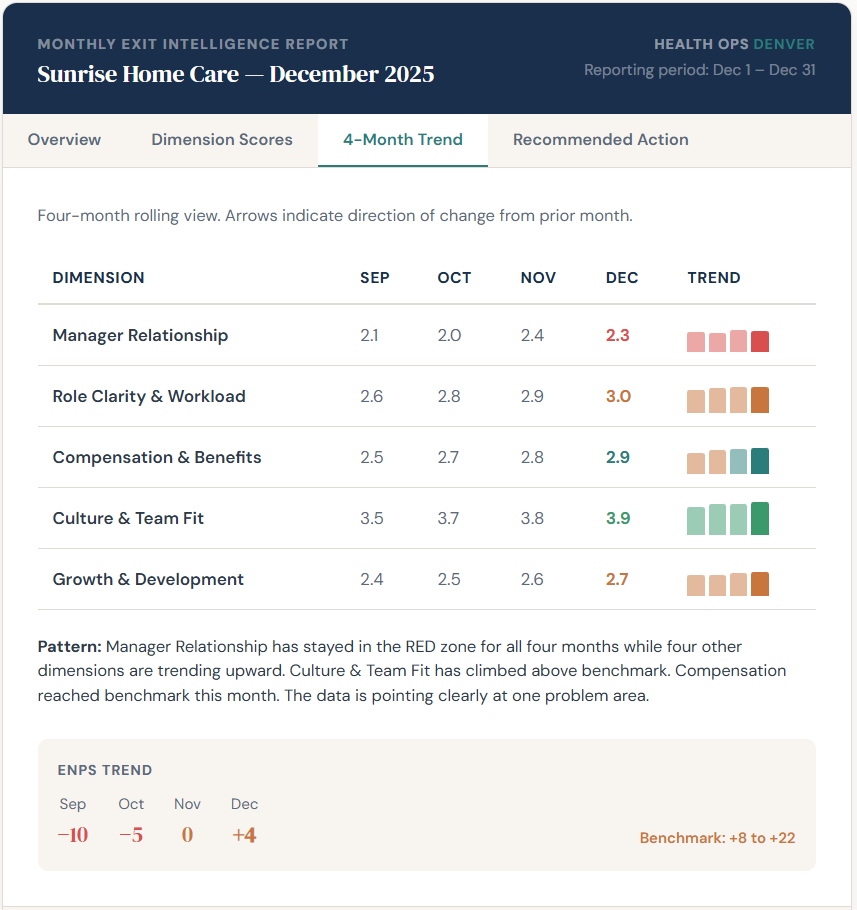
When two out of three departures score Manager Relationship at 2 or below and the open comments name a specific behavior (concerns ignored, requests not acknowledged), the report points at one supervisor and one specific habit. That's not a culture problem -- it's a coaching conversation. Owners who run that conversation in month 2 typically see the dimension score lift in months 3 and 4.
From recruiting more to losing fewer
If your push rate is running at 60%+ and most of those exits are early-tenure (first 100 days), the leverage is in onboarding and the first manager conversation, not in another job-board boost. Exit reports tell you which of those two ends of the funnel is leaking. At ~$2,600 per replacement, fixing one leak in a 30-caregiver agency at 75% turnover saves more than the subscription costs in a single avoided departure.
These are the patterns the monthly report is built to surface. Once we have customer reports we can share, we'll replace these illustrations with anonymized real examples.
Exit intelligence is retention intelligence.
Every exit survey is a look backward at what went wrong. But the patterns they reveal point forward. When the same dimension scores low across three consecutive departures, that's not a coincidence -- it's an operational signal telling you exactly where to intervene before the next person walks out the same door for the same reason.
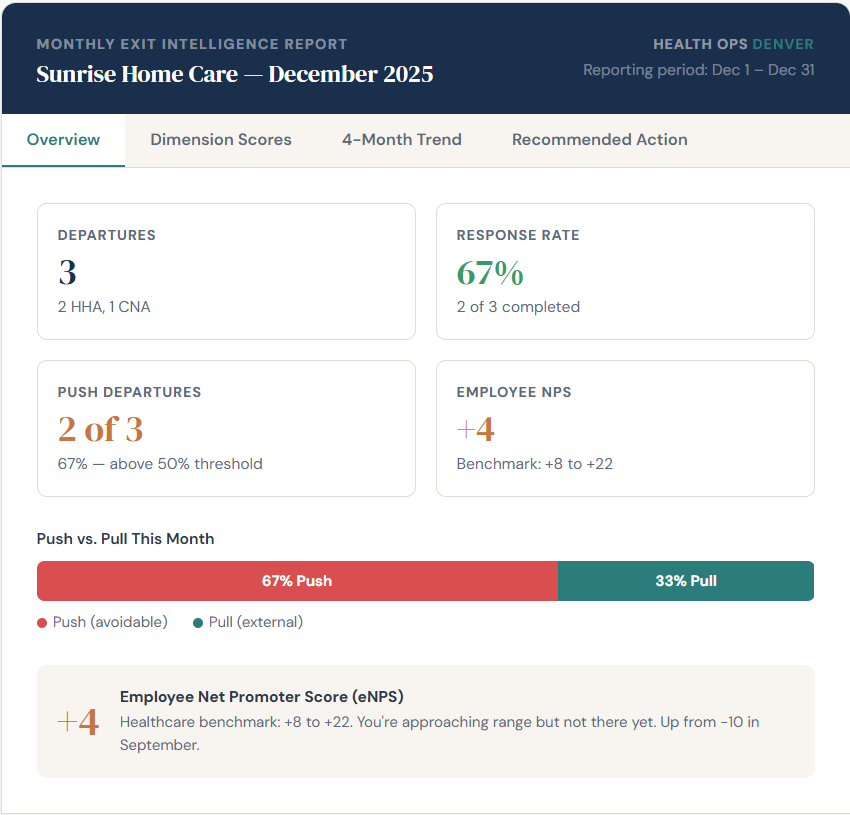
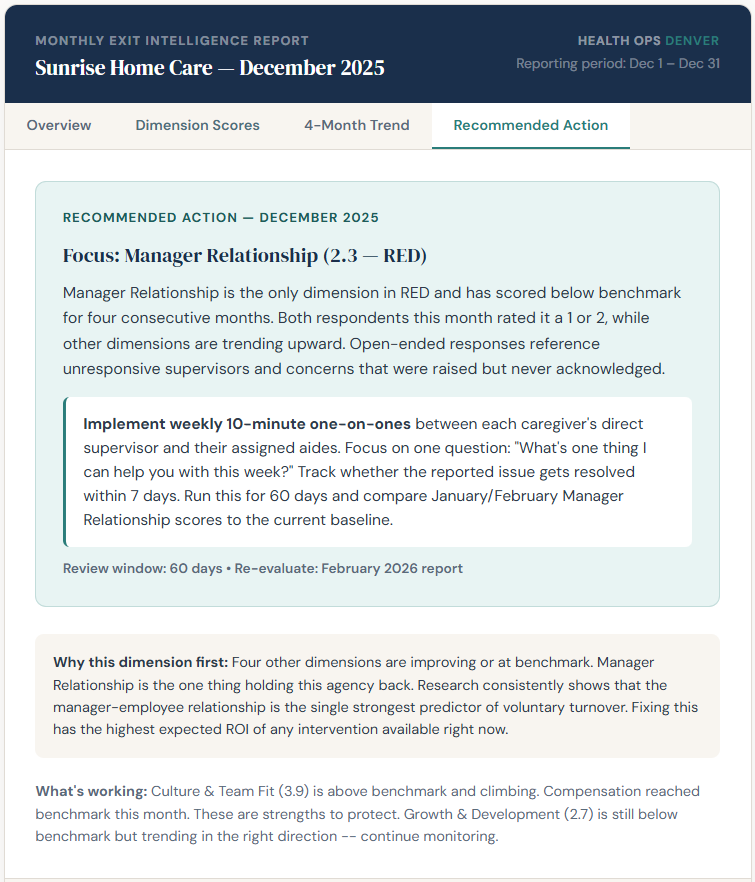
Here's what the monthly report looks like.
Four views. One clear recommendation. No raw data to interpret.
Don't want to run the surveys yourself?
Health Ops Denver sends a 10-question anonymous survey after every departure, scores responses across five dimensions, classifies push vs. pull, benchmarks your employee NPS, and delivers a monthly report with severity flags and one recommended action. $49/month, no contract.
Common questions about exit interviews in home care.
Employees give polite, non-specific answers face-to-face. Anonymous surveys sent after they've left produce dramatically more candid responses. They also reach people who leave without a final conversation, which in home care is a significant share of departures.
Onboarding survey tools check in with new hires at 15, 30, 60, and 90 days to catch friction early. Our service does the opposite end of the lifecycle: we survey people after they leave, anonymously, to find out why they actually went. Onboarding surveys tell you whether new hires are settling in. Exit intelligence tells you what drove the ones who left out the door. Use both if you can; if you can only do one, the exit data is the cheaper signal and points directly at the operational fix.
Turnover and replacement-cost averages come from 2025 home care industry benchmarking. Wage data: BLS Occupational Employment Statistics, May 2024. The five-dimension working targets are preliminary placeholders calibrated against the home care research literature; expect them to adjust as our own customer dataset grows. We update sources and figures annually.
Patterns still emerge with just a few surveys. Even a handful of responses start showing you where the problems are. The cost stays low at $49/month, so you're not spending much while the data builds -- and once you make a change, the continued data tells you whether it's working.
Yes. Responses are collected through a system that strips identifying information. Your monthly report shows aggregated dimension scores and themes, not individual responses. People are more honest when their name isn't attached.
You can, but keep it separate from voluntary exits. Someone who was terminated for attendance issues will score dimensions differently than someone who quit because their schedule kept changing. We recommend surveying both but flagging involuntary departures so the data stays clean. Your monthly report distinguishes the two.
Anonymous text-based surveys typically beat email and phone for this workforce. Realistic response rates land in the 30-50% range for cold exit surveys; well-timed surveys with strong anonymity assurances reach the upper end of that. The two factors that move the number most are timing (24-72 hours after the last shift, before the specifics fade) and trust (a clear anonymity statement, an outside number, no traceable identifiers in the report).
Text, email, or a simple online form. You send us a first name and phone number. That's it. No onboarding, no login, no software to install. We handle the rest.